6 Simple Steps to a Data-Driven Startup
Entrepreneurs have asked me, “What are the fewest things I need to make my business data-driven?” After spending the past year on the ground floor of a couple of startups, I’ve gained a better sense of the quickest steps to build a data-driven business.
My greatest takeaway is that, in the early stages of a business, planning how your company will use data is more important than implementing data solutions. Only two items in our list require technical implementation — instrumentation and reporting.
In this article, we’ll identify six actions (plus a bonus) you can take to pave a path towards a data-driven business.
- OKRs
- User Flows
- Profit Models
- Instrumentation & Events Catalog
- Metrics Catalog
- Reporting
- A/B Testing (Bonus!)
1. Objectives & Key Results
“What do OKRs have to do with data?” one may ask. However, John Doerr, the person attributed for bringing OKRs to Google, would answer “OKRs are data.” Specifically, they are data about our organization’s ability to achieve its expected goals. See Doerr discuss OKRs in more detail here and how Google uses OKRs here.
Objectives — a qualitative description of a team or company’s goals — articulate our business strategy. Key Results (or KRs) contain specific measures that track a team or company’s progress toward its Objectives. We call these measures Key Performance Indicators. KPIs are data that track our business’ progress towards its goals. Companies often overlook their internal data. Using OKRs in your organization is one of the easiest and most effective ways to be data-driven.
How to Make It Data-Driven
Data-driven companies consistently set OKRs, track them with KPIs, and embed them into daily business operations. These companies also use OKRs at the company, business, and team levels. Regardless of the level in the org chart, we should:
- Make them accessible. Make team, department, and company OKRs easily and widely available. Maintain dashboards that show KPIs next to their associated OKRs.
- Use them as a learning tool. Conduct retrospectives at the end of each quarter and year. Take retrospective learnings and incorporate them into future OKR planning and business operations.
- Store them as data. Track team and company OKRs in a way that we can access forever, ideally in a central repository. Store KPIs in a central database.
What To Do Day 1
Start by drafting a Company Mission Statement. This is a statement that articulates the high-level purpose and aspirations of the business. These will act as guardrails we brainstorm our company’s OKRs since each OKR should move the company towards its Mission.
2. User Flows
User flows are diagrams of how users move through our product. By (1) understanding how users move through our app, we can (2) quantify how users move through our app. And, as a corollary, we can (3) track and improve how users move through our app.
User flows also build a bridge between strategic and technical teams. For every step in the user flow, we should be able to specify the events (i.e instrumented actions), metrics, web pages, mobile screens, datasets, services, or any other technical entity that relates to that step in the user flow.

How to Make It Data-Driven
User flows capture users’ meaningful movements through our business — such as purchases on Amazon, a page creation on Notion, or an article read on Medium. Once we’ve identified meaningful metrics, we can optimize those metrics by improving the user experience.
Given this, there are a few simple ways to make the user flows data-driven.
- Identify the meaningful actions in the business — such as transactions, upgrades, or other indicators of increased loyalty to the product. Use Amplitude, Google Analytics, or the like to track users’ movement towards these meaningful actions.
- Create metrics that quantify transition points towards meaningful actions. For instance, if your meaningful action is “transactions,” a supporting metric could be “Transactions per MAU.” If “upgrades” is a meaningful metric, “% of Registered Users with Upgrade” can track this.
- Align A/B testing strategy with the user flow. We want to be as strategic as possible when choosing experiments to operationalize. Most tests take effort to properly implement and analyze; therefore, we should use our “meaningful action metrics” and historical tests
What To Do Day 1
Build a user flow for your core UX and/or features. If you have an engineer, refer to the user flow when identifying the events to the instrument. Refer to these resources about building user flows.
- UX 101: How to create user flows by Leow Hou Teng
- User Flow 101: What it is & How to do it by Gabriel Sa e Farias
3. Profit Model
Financial modeling seems like a challenging concept that requires a Series 7 or MBA. But don’t worry — we’re not talking discount cash flows here. By “profit model,” we mean a simple but analytically thoughtful approach to understanding how our business makes money.
When building profit models, we want to account for 4 things:
- Revenue. How we make money. We can use two simple frameworks — Revenue Decomposition and Customer Lifetime Value — to project revenue margins as our business scales (see more below).
- Cost of Goods Sold (COGS). Direct costs related to our product or services. This excludes external costs, such as marketing and human capital costs. We should know our production costs at the product level, as well as how those costs change when we sell 100, 1K, or 10K monthly units.
- Marketing Costs. How much does it cost to acquire a customer as we scale? We can simply use the average CPA, but we should also track how that changes as our acquisition spend scales.
- Contingencies and business dependencies that materially impact any of the points above. For instance, if costs fall significantly as we purchase more units from our suppliers, we should account for different supply levels.
How to Make It Data-Driven
We can use the following revenue frameworks to get a comprehensive view of revenues, costs, and favors.
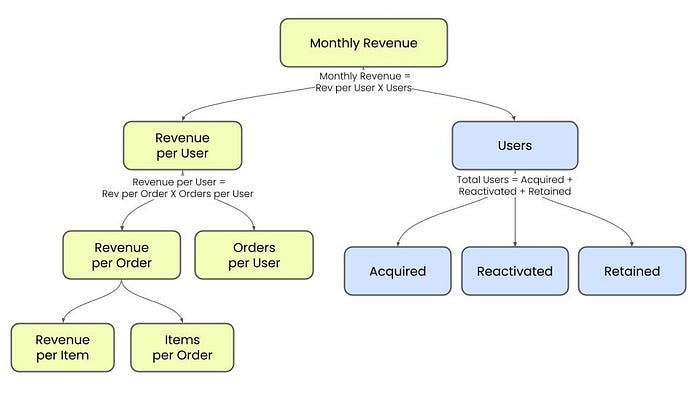
- Revenue Decomposition. This is a process where we deconstruct revenue into its subcomponents, e.g. revenue per user, transactions per user, and revenue per transaction. This article by GooglePlay’s Alyssa Perez on building a metrics tree provides a good summary of this approach.
- Customer LTV. We can model the revenue we receive from customers over time to understand their lifetime value to the business. It’s important to have awareness of this number and the factors that impact it as we invest in customer acquisition and retention. This article is a (not overly) technical overview of calculating LTV.
What To Do Day 1
Build a Revenue Tree. A Revenue Tree is simply a breakdown of revenue into its substituent metrics. Your business’ revenue tree will depend on its monetization. That said, we’ve provided a sample revenue tree below. See more here about building a metrics tree.
Build a Customer Lifetime Value (LTV) Model. Even before our business generates revenue, we can build an LTV model to serve as a projection and benchmark. As time passes, you will gain a more clear view of your customers’ LTV. Similar to the revenue tree, accurately modeling LTV depends on how the business makes money. However, a simple formula for LTV is:
LTV = ((Average Sales ✕ Purchase frequency) / Churn)) ✕ Profit Margin
where:
- Average Sales = (Total Sales) / (Total # of Orders)
- Purchase frequency = (Total # of Orders) / ( Total # of Unique Customers)
- Churn = 1 — Retention Rate
4. Instrumentation & Events Catalog
Before we produce data, metrics, or insights — we must collect the data. Events are actions that we can capture digitally. They are data’s moments of inception.
Instrumentation is the process of identifying and capturing events. Needless to say, the instrumentation process is very important. Garbage in, garbage out. And we should set instrumentation early as possible because, as time goes on, it’s increasingly difficult to change your data’s foundation.
How To Make It Data-Driven
There are two steps to instrumentation: planning and execution. Execution means adding tracking code to our product. Analytical platforms such as Google Analytics, Firebase, and Amplitude make implementation easier. However, the logic we establish during the planning is just as important as how we implement it.
This planning process should:
- Include PMs, Engineers, Designers, and Analysts. Building a product is a collective effort. Therefore, collecting information about the product should be as well. Different roles will provide different perspectives on how we should track user behavior.
- Take KPIs and other metrics into consideration. As we instrument our product, we should ensure that we can track all the metrics we use. If we’re using Google Analytics or Tag Manager, we should create custom events to track these metrics. Other analytics platforms (e.g. Amplitude) have similar functionality as well.
- Record event names, definitions, and other relevant metadata in an Event Catalog that is broadly available across the organization. This will give all employees visibility into how our data are produced. This, in turn, makes our entire organization more data-informed.
- Consider all data sources. Product instrumentation alone may not provide all of the information we need. We may need to collect data from 3rd party systems, audit logs, or employee/customer surveys. Dare to think unconventionally about data collection.
5. Metrics Catalog
”What metrics do I need for my business?” is another common question I hear from pre-launch founders. We’ve identified 3 frameworks to identify business metrics. However, a more important question to ask is “how should I use metrics in my business?”
We can think about how metrics are used in a business using a lifecycle. We can break this “metrics lifecycle” into 3 steps:
- Metrics Selection
- Metrics Production
- Metrics Usage
Metrics Selection
This is the process of identifying metrics to use within a company or team. Below are 3 metrics frameworks that will provide a comprehensive set of metrics for an early-stage startup.
- Revenue Trees. As discussed in the “Profit Model” section, this framework deconstructs our business’ revenue over a given time period.
- HEART Metrics. A framework developed by Google to help teams select a thorough set of product metrics. This article discusses how to set metrics using the HEART framework.
- VC Metrics. If you’re looking for outside capital, there is a set of metrics that VCs and other investors will commonly request. Examples include << give examples >>. This article outlines some of the common metrics VC firms use to evaluate startups.
How to Make It Data-Driven. In data-driven organizations, metrics are tailored to the business or teams they support. Company and team leaders ensure their team can improve the Key Performance Indicators they select
Metrics Production
This is the process of converting data into metrics that can be stored, updated, and visualized. We don’t need complex software or processes to produce metrics. Google Analytics, Amplitude, and other analytical SaaS platforms will provide most metrics without a single line of code.
How to Make it Data-Driven. Use a Single Source of Truth when sourcing and calculating metrics. Systems such as dbt help companies consistently query metrics across the organization.
Metrics Operations
Once we have metrics, we must leverage them in day-to-day business operations. There is a myriad of ways data-driven companies use metrics. The key is for teams to consistently show and discuss metrics across the organization, and hold themselves accountable to the KPIs they set for themselves.
How to Make it Data-Driven. Weave data into business operations, conversations, and stories.
- Business Operations. Anyone who completes revenue-generating tasks in your business will be able to complete them better with contextual information. The key is not to overwhelm non-technical employees with data visualizations — keep Ops reporting short and simple.
- Conversations. Agile teams and companies source perspectives of the entire team. These perspectives are shared through conversations, debates, or (at times) arguments. By adding facts (i.e. references to metrics and insights), we can make more informed communal decisions.
- Stories. It’s often said that business stories are the best way to communicate insights. By adding the occasional metric to your business stories, they will become more memorable and shareable for the audience.
Don’t Say This: The new release to our mobile app has been great! People like it and use it more than the previous version.
Instead, Say This: The new release to our mobile app has been great! Existing users spend 20% more time on the app per week than the previous version, and our mobile NPS increased 12 points!
6. Reporting
Once you have metrics, you must visualize them. Almost all businesses use reporting, but few use reporting to inform business decisions in a meaningful way. To do so requires the right culture and processes, as well as good reporting. For now, we’ll focus on the reporting itself, and discuss ways we can build reports that set our teams up for success.
There are 3 foundational types of reporting we should build for our startup. As the business scales, we can add more reports to our portfolio, but these will allow us to be data-driven from the outset and will become important assets for our business as it scales.
- Executive Reporting
- Product Reporting
- Operational Reporting
Executive Reporting
Though it’s in the name, these reports aren’t only for executives. These reports contain the most important information and metrics about the business, such as:
- Key Performance Indicators (KPIs) from company Key Results
- High-level metrics, such as MAU or MRR
- Custom metrics that are most relevant to the business
Similar to OKRs, executive reporting aligns all employees by providing a single view of the business. A manager once told me, “treat the business like you own it.” With executive reporting, you can give all employees an owner’s perspective.
Product Reporting
This report shows the health of your business’s core product. Generally, these are websites, apps, or other digital products; however, they can also be physical products, courses, or experiences. Regardless of what you sell, we must build a portfolio of metrics that track the performance of what we sell. We can use the metrics frameworks we discussed previously to build a robust set of product metrics.
Operational Reporting
Many startups make tremendous efforts to optimize their product, tracking and analyzing every interaction that users make. Yet they don’t consider customer-to-employee or employee-to-employee interactions. Operational reporting provides information to employees that help them do their daily jobs better. This may range from real-time information sent to assembly line employees to employee satisfaction metrics sent to managers.
How to make it Data-Driven
Again, reporting is everywhere. “Data-driven reporting” depends on the principles and processes used to build the report. Here is a short list of reporting principles.
- Be precise. A small change in a SQL query can substantially change in the definition of the metrics it produces. A small change in the definition of a metric can substantially change its relevance to the business. Therefore we should be precise about how we calculate, define, and communicate metrics found in reports.
- Be polished. Many people believe that aesthetics doesn’t influence analytics. They do. Use clean, simple visualizations that can be understood without an explanation (aside from what’s already in the report).
- Be contextual. People need information about a number to understand why the number matters. Adding metric definitions, hyperlinks to references, or metadata about the data source (e.g. date-time since the last update) helps viewers comprehend what they’re viewing and why it matters.
7. A/B Testing (bonus!)
The purpose of analytics in any organization can be broken into 4 areas:
- Understanding the business
- Identifying ways to improve the business
- Implementing methods to improve the business
- Calculating the impact of said improvements
Analytics generally focuses on #1, #2, and #4. #3 is more often completed by Engineers (by making changes to the product), Strategists (e.g. by changing campaigns and marketing spending), or Operators (by executing revenue-generating tasks).
Of the steps we’ve discussed in this article, Steps 1–6 are focused on understanding the business. A/B testing is one of the ways we can identify ways to quantify the impact of changes on the business.
We should implement A/B testing as early as possible. Doing so will create a strong test-and-learn culture that will persist as the business scales. And implementing A/B tests doesn’t require complex software or processes (provided that we have accurate instrumentation). Google Optimize is a free, easy solution for A/B testing.
How To Make It Data-Driven
When conducting A/B testing, we should:
- Think strategically about what to test. Prioritize tests that can have the greatest potential impact on the business. Maintain a backlog of tests the team would like to implement and refer back to it when considering new tests.
- Treat experimentation as a continuous learning process. Collect results and takeaways from every experiment. With a centralized experiments repository, your team will eventually gain “meta insights” about the levers that best impact your business.
Conclusion
Analytics is often an afterthought for founders of early-stage startups. There are so many responsibilities to “keep the lights on” and data, frankly, isn’t on that list.
The problem is that good data practices become imperative as the business scales (hello, auditors), and data-informed decisions will as well (hello, competitors). And, if we don’t think strategically about data from the start, building an effective analytics practice will be far more challenging in the future.
